Stories
The brain mechanisms of aggression
Motivational systems of social behavior
International Society for Research on Aggression
Behavior Genetics Association Ethics Committee
The World Wide
Runners Club
for Peace
United Nations University for Peace
Charlie Robbins, barefoot runner
* * *
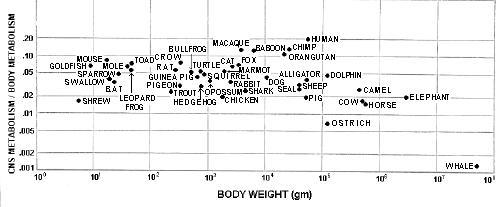
One of the perennial puzzles in brain research has always been the apparently complex relationship between brain size and body size. In particular, there is a great increase in the ratio of brain to body size in warm-blooded animals.
I had long been intrigued by the similarity of two complex functions: brain weight as a function of body weight; and basal metabolism as a function of body weight. In discussing this with two of my best undergraduate students at the end of the 1970's, Jon Mink and Rob Blumenschine, we speculated that the relationship might be quite simple if one assumed that brain metabolism was a constant proportion of overall metabolism. Intrigued with this possibility, I set them the task of amassing the relevant data from the literature, and their results were quite remarkable. We found that most animals use 2-8% of their metabolism for the central nervous system (brain, spinal cord and nerves). In searching through all of the literature on this subject, we found an obscure publication by G.W. Crile in 1941 that came to a rather similar conclusion, but without the needed documentation. We had, indeed, discovered a new scientific law
Our documentation was a laborious task. Brain and body weights were often available, but to obtain spinal cord weights as well was not common, and sometimes we ended up having to make our own observations on preserved specimens. Metabolism data for the brain and spinal cord were even more difficult to find in the literature, and considerable analysis was needed to obtain the needed information.
The final published paper includes a very elaborate table of weights, metabolic rates and calculations for 42 species, including fish, amphibia, reptiles, birds and mammals.
 |
Publishing the results turned out to be a problem. In February 1979 we sent it to Science Magazine, which has a very wide readership , but it was rejected for publication. There was only one reviewer who said that "the paper contains no original data" and "the results of the analysis do not lead to any conclusions about why there is such a relationship."
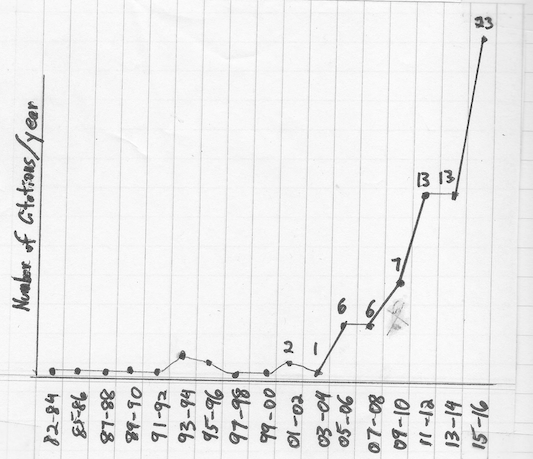
We then sent it to the American Journal of Physiology where it was published in 1981, but it was lost there because very few people referred to it for the next 25 years. Instead, Science Magazine published in 1983 a much inferior paper, based in part on our study, which is often cited instead of us. It would seem that the reviewer stole our ideas and published them himself (something that happens all too often in science!). As of 2006, according to the Science Citation Index, our paper had been cited 35 times while the paper by the other author in Science had been cited 95 times.
However this changed after 2006, as shown by the following graph. It goes to show that you need patience for the truth to come out. It reminds me of the graph for the recognition of human rights which took many years after the Universal Declaration of Human Rights was adopted by the UN.

 |
Stages
1986-1992
Fall of Soviet Empire
1992-1997
UNESCO Culture of Peace Programme